When Matt Denberg forded the Chetco on June 9, it was probably similar to a hopscotch. Then a coastal storm came in and started dropping rain, rising river levels significantly.
15 JUNE 2017 | BAILEY MOUNTAIN TRAIL 1109, KALMIOPSIS WILDERNESS — After a heroic airlift rescue from the Kalmiopsis Wilderness, we thought readers might find some tips on interpreting stream flow data useful.
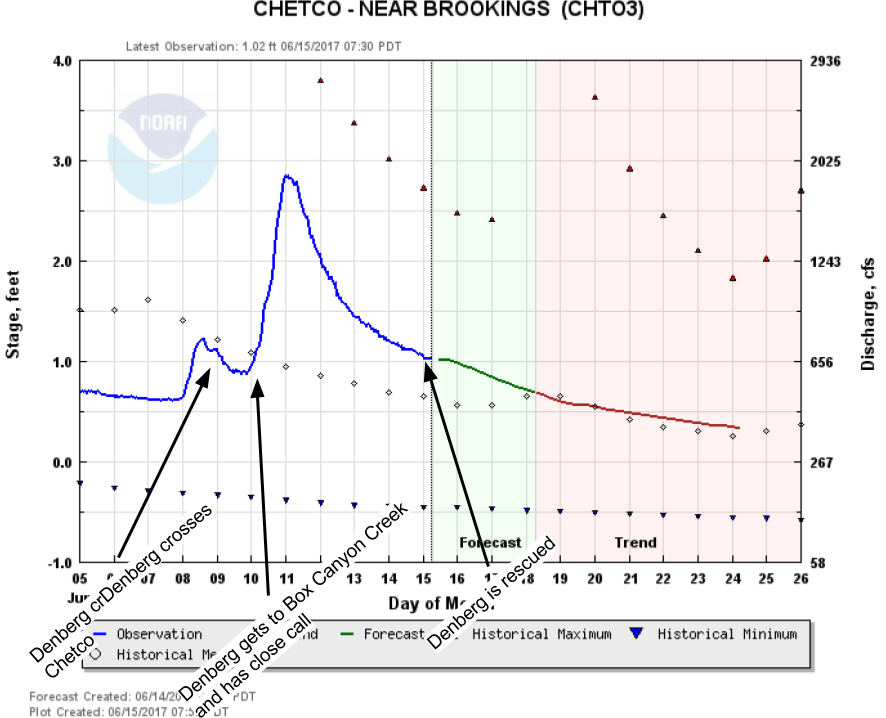
Hiker Matt Denberg hiked across the Chetco on Bailey Mountain Trail 1109 as a storm was building on the Pacific. It was June 9 when he crossed. Check out the streamflow data from lower down on the Chetco from then: 
The graphic shows the river rise abruptly after Denberg forded the Chetco on June 9. He was stuck between there and Box Creek, another significant stream ford. Then the graph shows the river come down to levels near where he crossed in the first place. And when Denberg got to Box Creek, the Chetco at Brookings hadn’t spiked yet.
So one may think: Why didn’t he just cross back and make his way out? Why couldn’t he ford Box Creek when the Chetco gauge was at relatively low levels?
Because the USGS gauge is near Brookings, not on Box Creek or Blake’s Bar. Brookings is much lower down on the river than where Denberg was posted up. Between there and Blake’s Bar, there are a handful of large tributaries. The river changes shape, the canyon squeezes and opens back up. The weather between there and Brookings is also different.
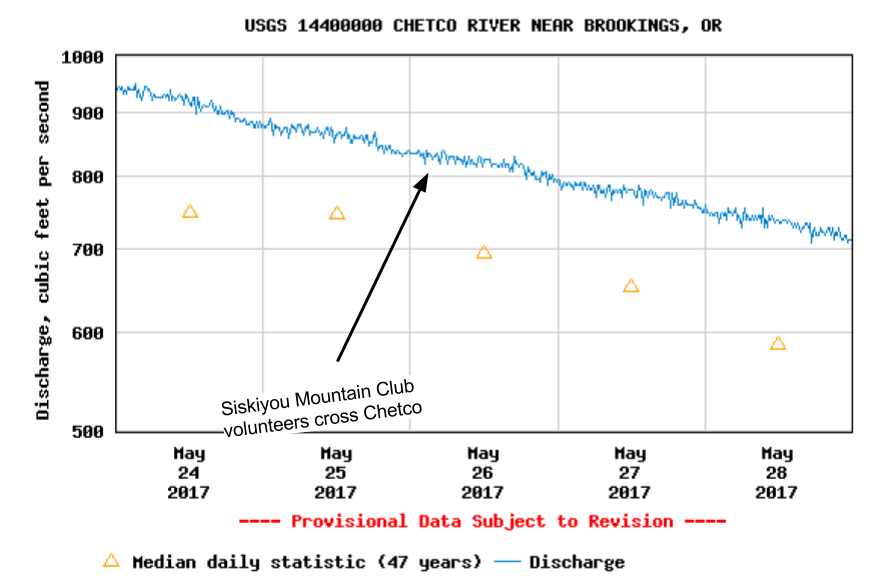
Our Memorial Day crew this year crossed the Chetco at the same spot when it was at similar levels, in Brookings: 
The takeaway? Stream flow data and predictions from the USGS are very powerful tools to plan ahead and prepare for your hike. This year, with unusually high river levels and snow pack still to melt, these tools are especially useful.
But also remember that the backcountry is a volatile, uncontrolled environment, and all the data in the world can’t replace good decision making. Read more about how to plan ahead and prepare.


